Welcome to Trends in Global Energy. A few definitions before we commence with the lecture. First, we define conventional energy as energy that's obtained from fossil fuels, such as coal, oil, and natural gas, as well as hydroelectric and nuclear energies. Alternative energy comes from solar, wind, tidal wave, geothermal, and biomass sources. And finally, renewable energy comes from alternative energy (solar, wind, tidal wave, geothermal, and biomass energy) plus hydroelectric power.
Also, keep in mind that fossil fuels are a finite resource and the only way to meet the future demand for energy will be through the use of alternative energy sources.
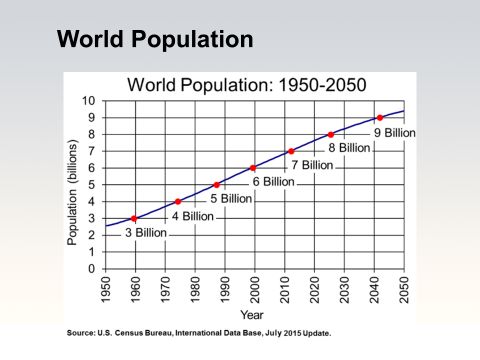
As we talk about trends in global energy production and use, we need to keep in mind the increasing world population. We're currently at more than seven billion with an expectation of the population growing to more than nine billion by 2050.
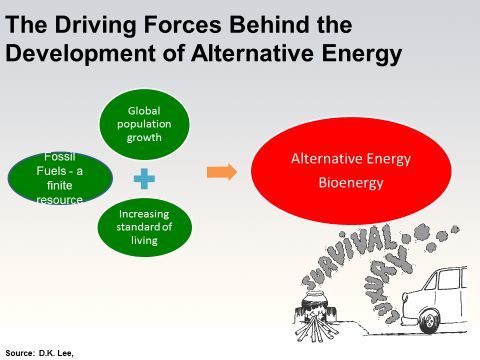
Fossil fuels are a finite resource, the global population is growing, and there is an increasing standard of living in much of the world. As the economies in countries such as India and China strengthen and grow, along with the wealth of individuals, the standard of living increases. Given these driving forces, we'll have to develop alternative energy sources, most likely including bioenergy, to meet the demands of a growing world population.
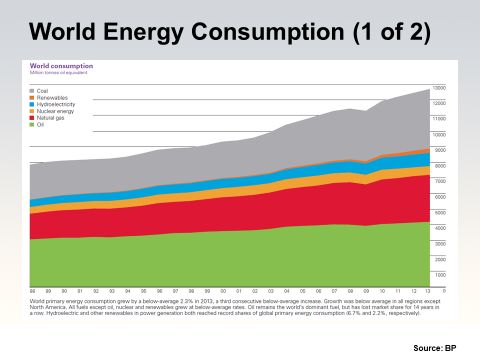
This is a 2013 graphic showing the world's energy consumption. We can see that coal, renewables, and oil are the main players. Oil remains the dominant source of energy. There's also been a large increase in the use of coal, particularly in countries such as China. Finally, there's been a large increase in the use of hydroelectric energy, as well as other renewable energy sources, most specifically for the creation of electricity.
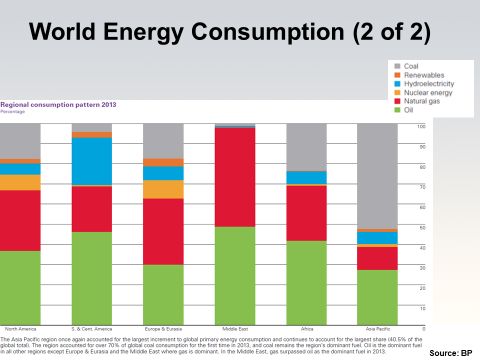
Here we see the consumption of energy in world regions. The Asian-Pacific region, which includes China and India, has the biggest growth in the use of energy with coal being the dominant source of energy in those locations. In fact, that region uses approximately 70% of the coal that's used in the world. If we look at other areas of the world, we see that natural gas is a large source in the Middle East and Europe. And then finally ,oil is a large player throughout much of the rest of the world.
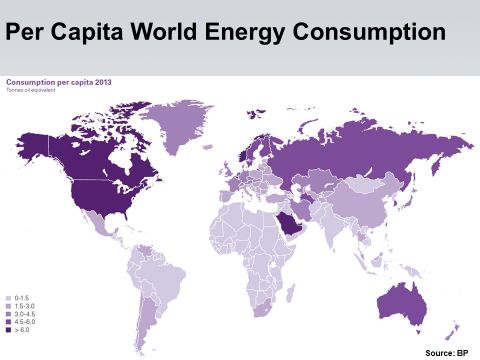
This map illustrates the per capita use of energy throughout the world. We see that North America, a small portion of Northern Europe, and Norway, as well as part of the Middle East, are the world's greatest consumers of energy. As would be expected, energy consumption in Third World countries is at the lower end of the scale. You may remember from an early lecture that the human development indexes or a wellness scale, is based on energy consumption.
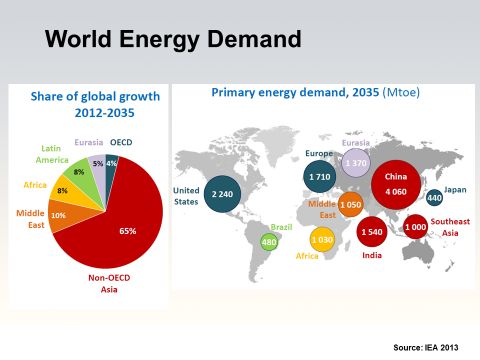
Here are two graphics developed by the International Energy Agency showing world energy demand . On the left we see the growth of energy demand from 2012 to 2035. We see that the largest growth, far and away, is the non-OCED Asian countries. The OECD is the Organization for Economic Cooperation and Development. Its members are mostly from western countries, Japan, and Europe. China is not a member and that that's probably where the largest growth is going to occur. We see that in OECD countries, again, mostly the western countries and Europe and the U.S., growth is going to be relatively small compared to what we see in some of these Asian countries.
If we look at the right, we can see the graphic indicating the primary energy demand in 2035. While the U.S. still has a very large energy demand, the main demand for energy is going to occur in China. We see that Europe and India are also going to require large amounts of energy. This gives us an idea of where energy is going and how it relates to the economic wellbeing in those areas.
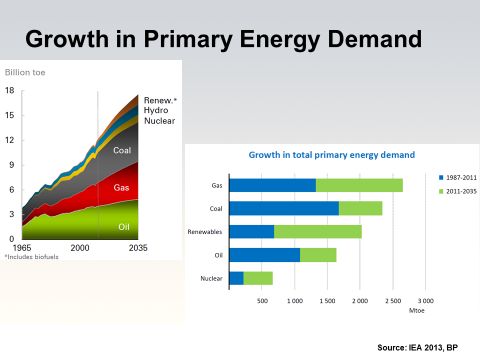
Here are two graphics showing the increase in energy demand around the world. If we look on the left graphic, we see that renewables, hydroelectric, and nuclear-electric are having an increased role. Although the growth in fossil fuel energy demand continues to grow at a faster pace. In the right, we see that through 2011, renewables have a relatively small role compared to coal and gas but is the largest growth area of any of those primary sources of energy from 2011 through 2035. Overall, today's share of fossil fuels in the global mix is at 82% and that's the same as it was 25 years ago. A strong rise in renewables only reduces this to around 75% in 2035. Thus, even though the demand for renewable energy sources in growing, the demand for fossil fuel sources will still comprise the vast majority of energy demands in the world.
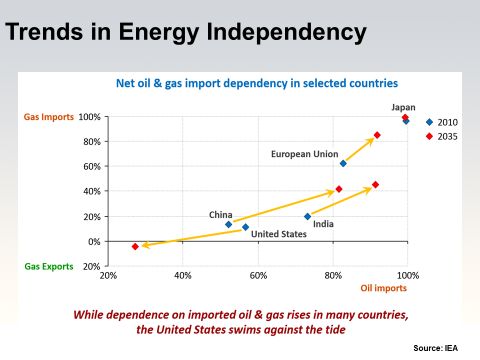
Throughout the world, dependency on imported oil and gas will grow between 2010 and 2035, outside the U.S.. Primarily, this can be attributed to the U.S. tapping into domestic oil supplies, as well as to the increased use of non-fossil fuel energy sources.
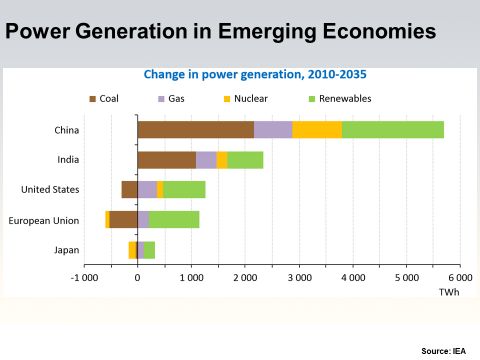
We see a great increase in the demand for power generation in India and China as their economies grow. We can also see that the demands in the U.S., the European Union, and Japan grow far less. While the worldwide demand for power generated from renewable sources is growing, we can see that China and India are still mostly dependent on generating power from coal and will be through 2035.

In the remainder of the lecture, we'll talk about biofuels and bioenergy in the European Union, Brazil, and in the United States. Remember that the positive aspects of biofuels are: (1) that they are good for the environment (we're not adding to the levels of carbon in the atmosphere); (2) this is a source of liquid transportation fuels that the U.S. is dependent on; and (3) there's a tremendous potential for improvement. We can upgrade our feedstocks, feedstock management, and feedstock processing to create the fuels that we're looking for. This is an area where a great deal of potential exists and growth can take place.
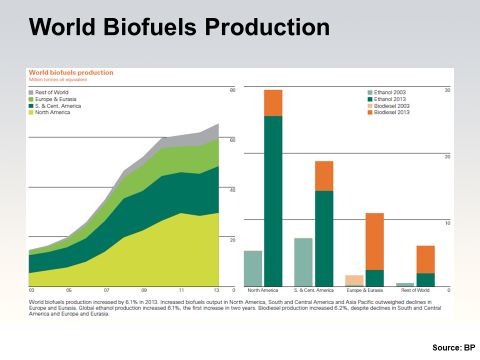
These two graphics illustrate the world's biofuel production between 2003 and 2013. The graph on the left illustrates the worldwide production of biofuels and how it's gone up between 2003 and 2013. Most of the growth in biofuels use that has occurred in North America is primarily as ethanol produced from corn.
In the right graph we can compare the amounts of biodiesel and ethanol that were produced in North American, South and Central America, Europe and Eurasia, and the rest of the world in 2003 and then again in 2013. Note that in North American and South and Central America, the increase in ethanol production. Again, this is from corn-based ethanol in North America and sugarcane-based ethanol in South America. Compare that, to the increase in biodiesel that we see in Europe and Eurasia and the rest of the world where canola (oil rapeseed) is the primary source. This is positive because, overall, there has been a large increase in the production of biofuels on a worldwide basis within that 10-year timespan.
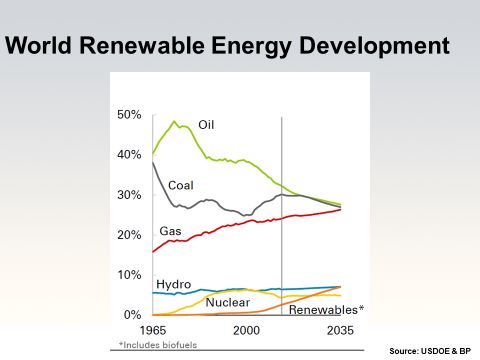
This graph illustrates the renewable energy development in the world over the next 20 years. This forecast shows that renewables have the largest potential growth over that 20-year time period. Natural gas also increases considerably. The forecast for renewables is going up in a more accelerated rate., and in fact, several studies have indicated that the world's demand for biofuels will expand at a rate of almost 20% per year as we move forward.
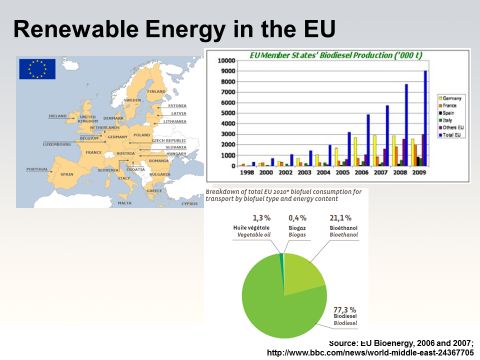
Renewable energy in the European Union, to this point, has revolved greatly around the production of biodiesel. As illustrated in the two graphs on the right side of this slide, biodiesel makes up the greatest percentage of the renewable energy produced there. Overall, by 2020, the European Union's goals are that 20% of it's energy will come from renewable sources and used in biofuels, heating and cooling, along with a goal of 10% of transportation fuel coming from renewable sources by 2020.
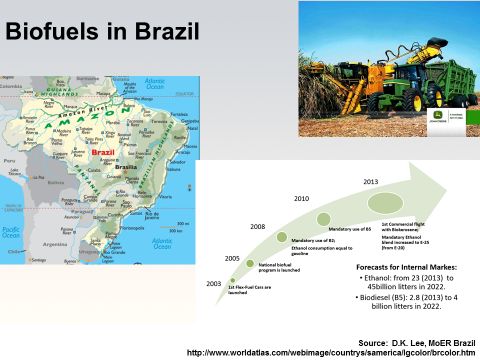
Because of Brazil's production of bioethanol, it's one of the more advanced bio-economies in the world. In 2010, Brazil harvested more than 800 million tons of sugarcane with more than 55% of it used to produce ethanol. More than 7 billion gallons were produced in 2014. In the past, ethanol was a major export from Brazil, but that's been scaled down recently because of strong demands for the ethanol at home and increased sugar production. There is mandatory blending of ethanol with gasoline in Brazil and, at present, it's between 18 and 25% ethanol mixed with gasoline.
In June of 2015, U.S. President Obama and President Rousseff of Brazil met and announced a joint agreement to increase renewable energy use and decrease greenhouse gas emissions. In the U.S., President Obama pledged to increase its share of renewable energy to 20% by 2030, which is about triple the percentage of energy currently produced from non-hydro-renewables. And in Brazil there was a pledge to double its use of renewables by 2030. Both countries are making a commitment to improving the atmosphere, as well as increasing the use of renewable fuels.
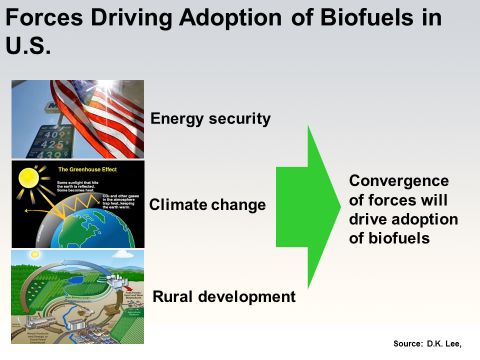
In the U.S., the needs for energy security, for combating climate change, and for developing rural America have been driving forces for the adoption of biofuels. The U.S. advisory committee that wrote the initial Billion-Ton study had a goal of displacing 30% of our current fossil fuel use with biofuels by 2030. Past goals set by U.S. government administrations have been to reduce oil imports by 1/3 by 2025 and to put 1 million electric vehicles on the road by 2015 (not sure that we've met that administrative goal). By 2035 there was a goal to generate 80% of electricity in the U.S. from a diverse set of clean energy sources and to make non-residential buildings 20% more energy efficient by 2020. A final administrative environmental goal was to reduce 2005 greenhouse gas emission levels by 17% by 2020 and by 83% by 2050.
In this lecture I've tried to support the increased use of renewable energy and we see that is taking place in several parts of the world. We know that the European Union, Brazil, and the U. S. all have great interests in renewable energy, and interest is also increasing in the developing economies in China and India. We know that the world's population is growing, that there's a finite amount of fossil fuels, and that the standard of living of the world's growing population is rising. Alternative energy, including renewable energy, will be important to meet the needs of a growing population demanding a higher standard of living.