
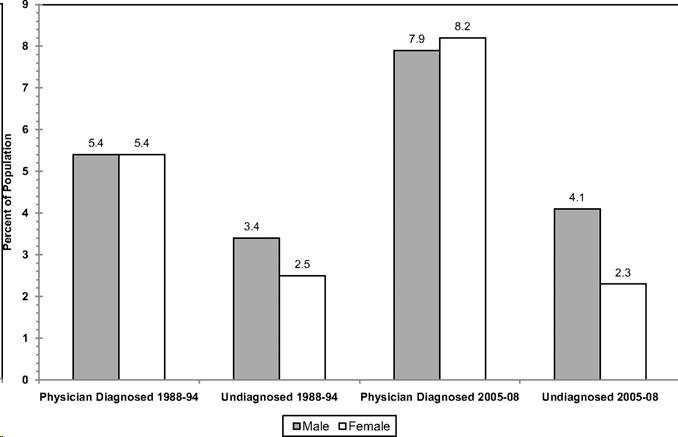
Trends in diabetes mellitus prevalence in adults =20 years of age by sex (National Health and Nutrition Examination Survey: <br />1988-1994 and 2005-2008)
On this graph you can see the trends in the prevalence of adult diabetes in the US for both males and females, and you can see them for two different years, at the span of 1988 to 1994 on the two left-hand bars, and the two right-hand bars you can see 2005 to 2008. And what you see is that from the periods from 1988 to 1994, the diabetes rate was about 5% of the population, and now, in 2005 to 2008, it was about 8% of the population, and there's not a significant difference between males or females here that you see as well. So you see a pretty dramatic increase in diabetes. We'll talk about why this might be the case in a few slides.