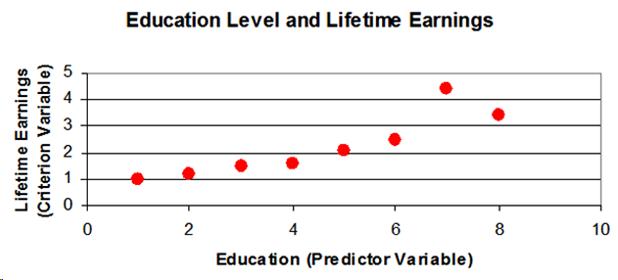
Previous | Next

Full View

Contents of Scatter Plot (1)

Scatter Plot (1)

Illustration of a scatter plot displaying the data of lifetime earings and level of education.

Graph illustrates the relationship between level of education and lifetime earnings

A table of data. Column 1 is years of education. Column 2 is earned lifetime income.