Precipitation is one of the single strongest factors driving hydrologic processes. As air cools its ability to hold water decreases and some turns to liquid or ice that falls to ground.
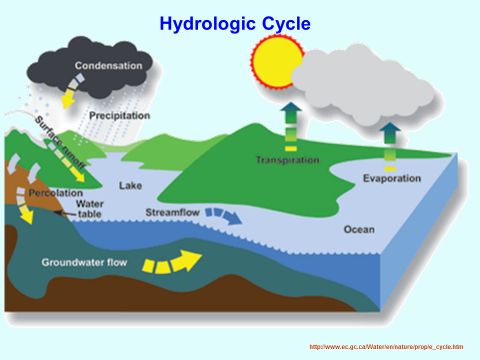
Rain water or snowmelt eventually moves into a surface water body such as a lake or an ocean. The sun energizes this water, and it reenters the atmosphere through either evaporation or transpiration. The cycling of water is known as the Hydrology Cycle.
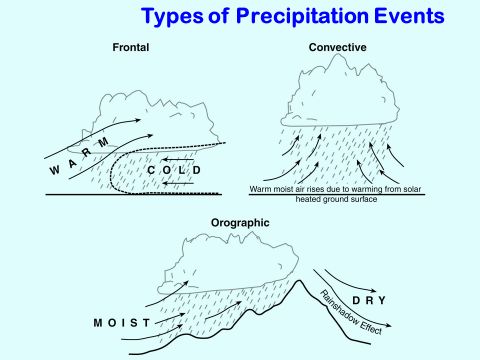
A precipitation event may be frontal, convective or orographic. Frontal events occur when air masses of two different densities interact, such as warm air being lifted over cold air. Much of the rainfall in Illinois is frontal. Afternoon thunder showers are mainly convective. Warm, moist air rises due to warming from the sun. Rain falls when the storage capacity of the atmosphere has been exceeded. Rainfall on the west side of the Cascades results from moist air rising above a physical barrier.
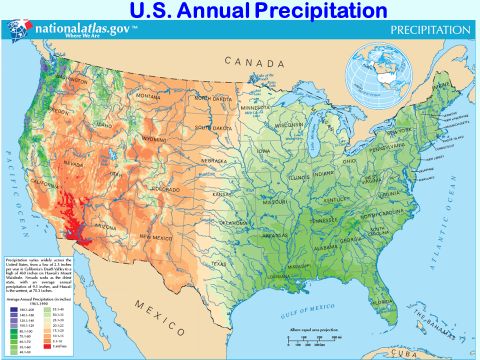
With the exception of the west side of the Cascades, rainfall increases from west to east across the US. Annual rainfall is lowest in the southern deserts of California and Arizona, and highest in the Pacific North West.
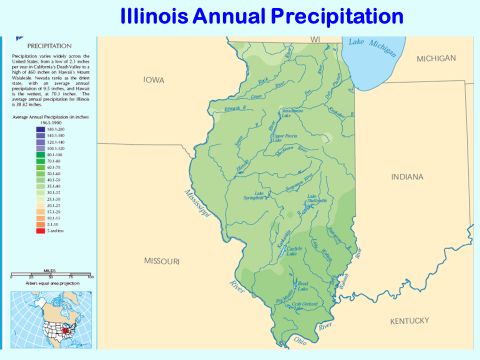
In Illinois, highest annual rainfalls occur in the south west, and the lowest are in the north east.
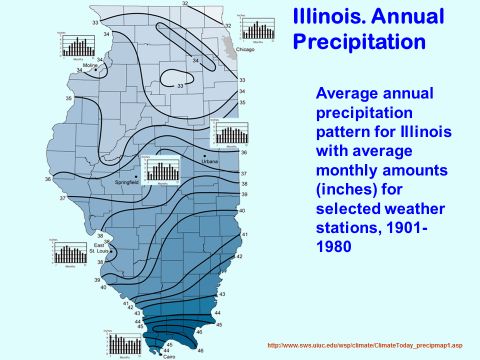
Average annual rainfall across the state varies from 46 in 32 inches. The average is close to 36 inches.
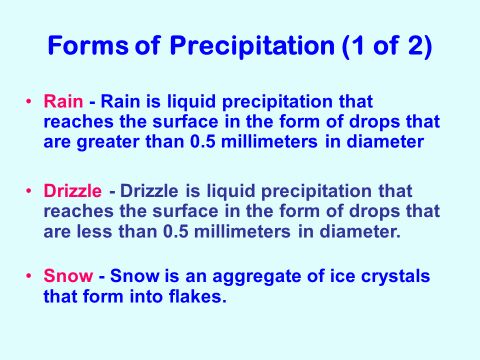
Common forms of precipitation include rain, drizzle and snow. In a drizzle, raindrops are less than a half of a millimeter in diameter.
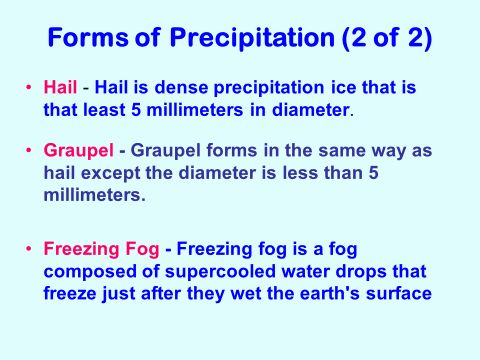
Less common forms include hail, graupel, and freezing fog. Hail consist of dense ice particles in excess of 5 mm in diameter. Hail is typically created by strong thunderstorms in which air is quickly drawn upwards. It can cause damage to crops and cars.
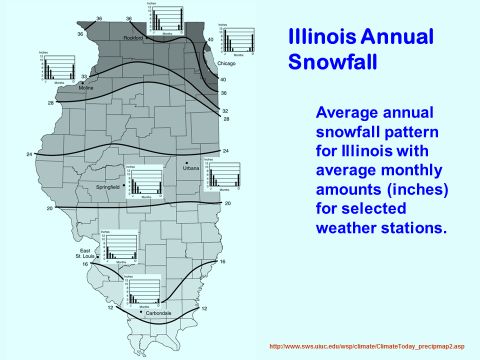
Average annual snowfall depths increases from south to north in Illinois. However, in recent years, these patterns are changing.
Snow may be 5 to 60% as dense as water, with 10% being most typical. Thus 10 inches of snow contains the same amount of water as 1 inch of rain.
Rain is usually measured at discrete points and averaged across an area. Rain gages should be placed in areas where they are unaffected by wind, trees or buildings.
The standard height of a rain gage is 1m above ground level.- all gauges in a catchment should be the same height.
Gages should be 2 to 4 times the height of an object away from it. In forested areas gages should be placed in clearings, or placed at canopy level. <br />
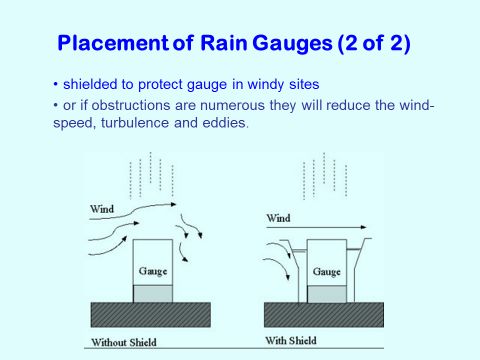
Gages should be shielded from the wind in windy areas. At such sites, unshielded gages do not yield true precipitation.
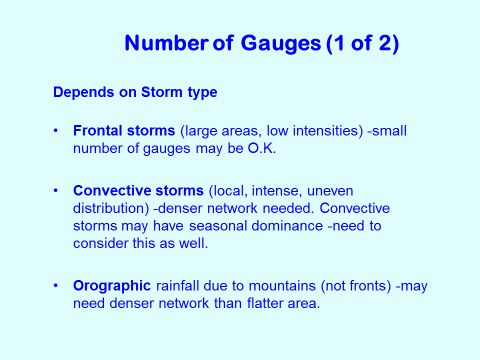
The number of point gages needed to characterize an area varies with the type of precipitation event. Frontal storms are usually of low intensity and cover large areas, A small number of gauges may be O.K.
Convective storms require a denser network as they are localized, intense, and unevenly distributed.
Orographic rainfall due to physical obstructions may need denser network than flatter area.
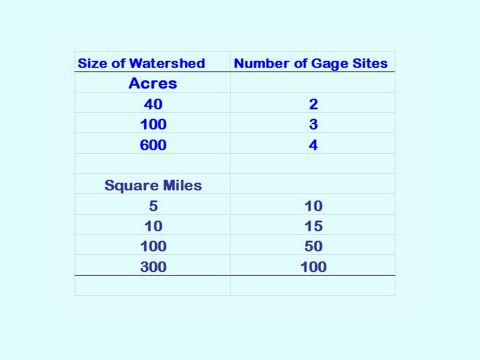
Here are average number of gauges required to characterize precipitation over areas of different sizes.
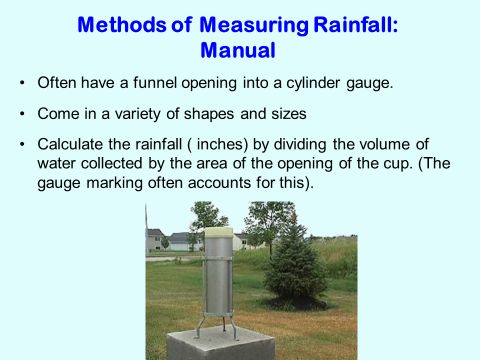
Rainfall is measured with rain gages. These come in a variety of shapes and sizes. They typically have a funnel opening into a cylinder gauge. Rainfall depth is
calculate by dividing the volume of water collected by the area of the opening of the cup.
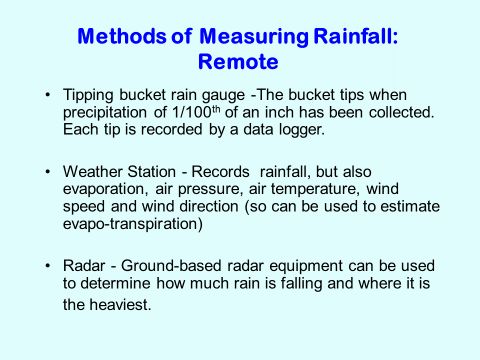
There are several methods for measuring rainfall at remote locations.
Tipping bucket rain gauge -The bucket tips when 1/100th of an inch of precipitation has been collected. The time when each tip occurs is recorded by a data logger.
Weather Station - Records rainfall, as well as evaporation, air pressure, air temperature, wind speed and wind direction
Radar - Ground-based radar equipment can be used to determine how much rain is falling and where it is the heaviest.
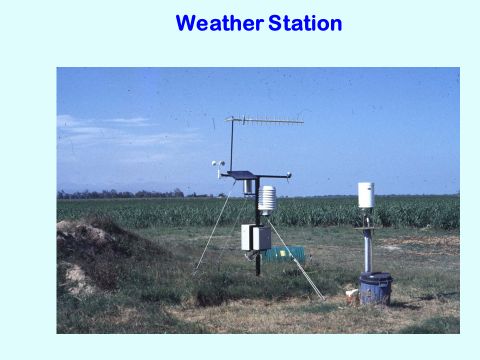
Here's a weather station that is used to measure several climate parameters. A solar panel is used to recharge the battery connected to the data logger. Thus the weather station can be used unattended in remote areas.
Point rainfall must be averaged to determine areal rainfall amount. Common averaging techniques involve
Arithmetic averaging
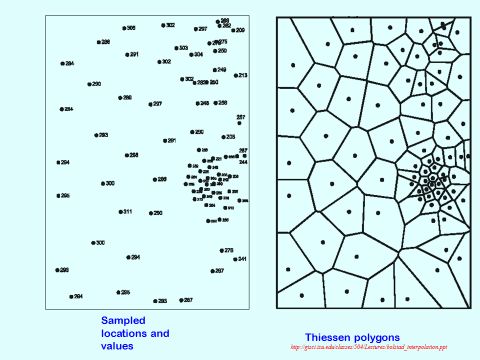
The use of proximal maps (Theissen polygons)
And the use of Isohyetal methods
Although, most of these calculations are done with computer mapping programs, it is still useful to understand these methods.
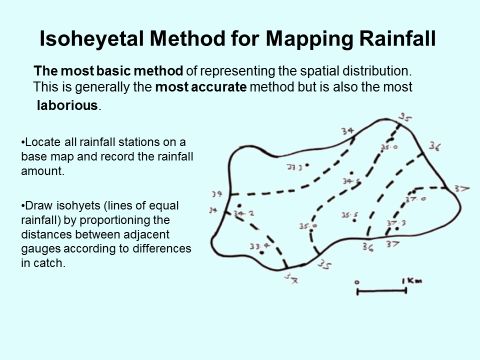
The isohyetal method involves interpolating between point values and drawing lines of equal rainfall amounts, known as isohyets. The rainfall amounts are weighted by the area closest to each line. There are several interpolation methods that are typically used.
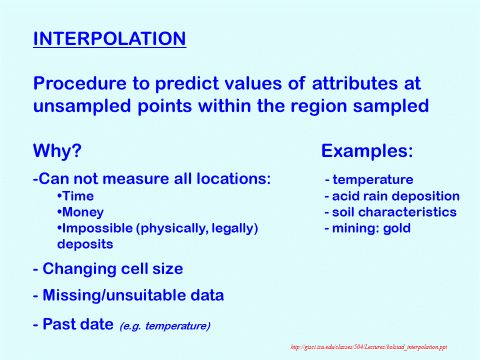
Interpolation is the process of predicting values of attributes at un-sampled points within the region sampled. In addition to rainfall, it is used for several parameters including, elevation, temperature, and soil characteristics.
There are many different interpolation methods.
Methods differ in weighting and number of observations used
Each method produces different results (even with same data)
No method best for every application
The most common methods used for interpolating rainfall are
The nearest neighbor method
Inverse distance weighted methods, and
Kriging
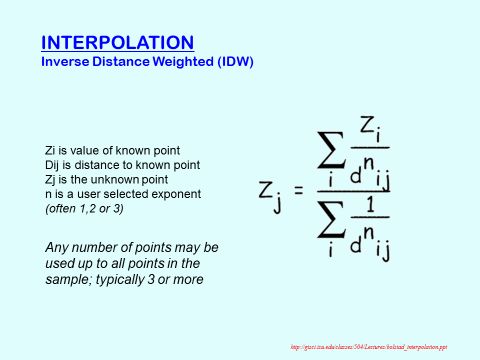
In the Inverse distance method, the values at unknown points are estimated using the distance to and values at nearby know points (IDW reduces the contribution of a known point to the interpolated value)
The weight of each sample point is an inverse proportion to the distance.
The further away the point, the less the weight in helping define the unsampled location
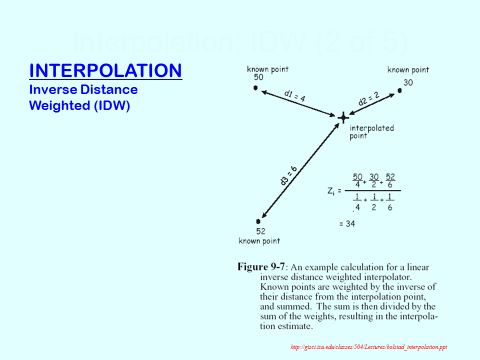
Here is an example where the weighting exponent is one. More often, an exponent of 2 is used. Thus the method is often called the inverse distance squared method.
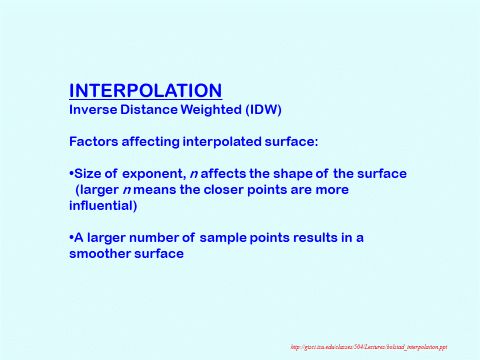
In this method, the size of the exponent affects the shape of the surface. Larger exponents give more weight to closer points.
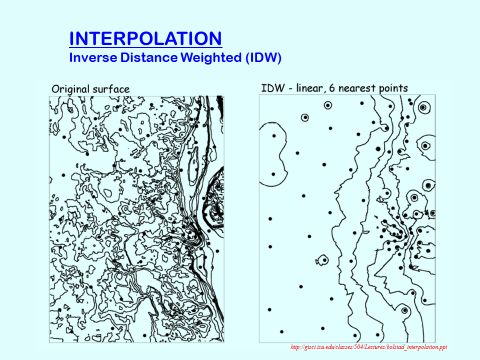
Here is a surface that was recreated using the inverse distance method with the 6 nearest points. Note the circles around the measured points. When this method is used, the sampled points become points of minima or maxima, and the interpolated value at a measured point is not the same as the measured value.
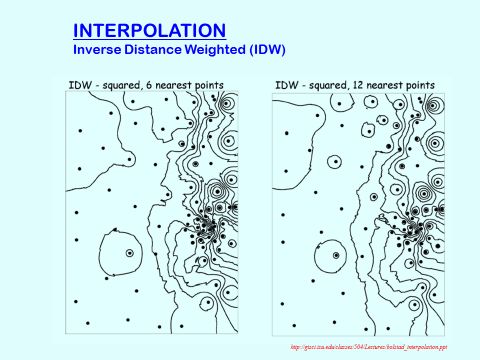
Here is the same surface recreated with the inverse distance squared method with 6 nearest points, and with 12 nearest points. The results are closer to the original surface with the inverse distance squared method, and with more points.
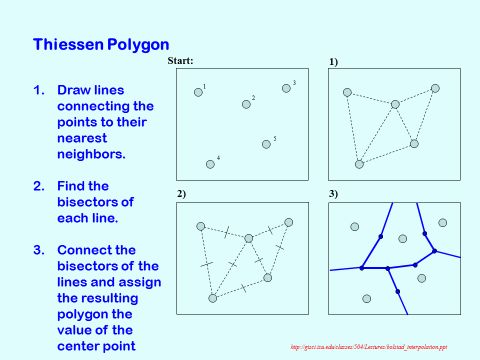
The Thiessen Polygon method Assigns interpolated value equal to the value found at the nearest sample location.
It is conceptually the simplest method.
Only one point, the nearest sampled point, is used to determine the precipitation at un-sampled points. This produces what is also called a proximal map or a Voronoi diagram
Here is the same surface above re-created with Thiessen polygons. The contour lines are bunched up along the perpendicular bisectors. If the inverse distance method is used with a very high exponent, the resulting surface is indistinguishable from the Theissen polygons.
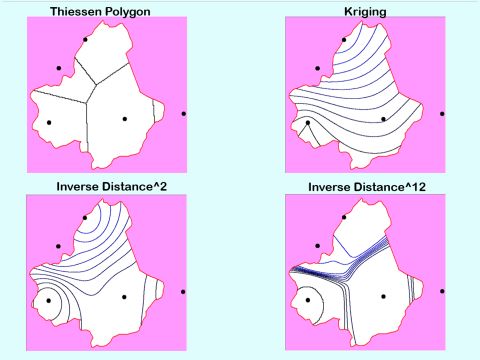
Here is a surface recreated with 4 interpolation methods. Note the similarities between the Thiessen polygons and the inverse distance^12 maps. Note also that kriging does not produce points of maxima or minima at the sampled points. The method also reproduces the exact value at sampled points.