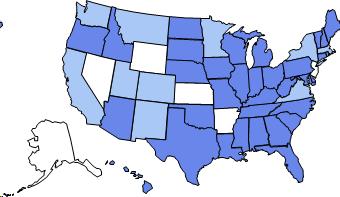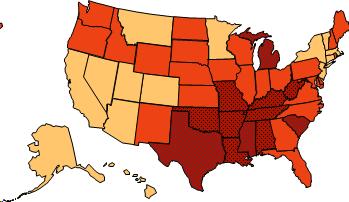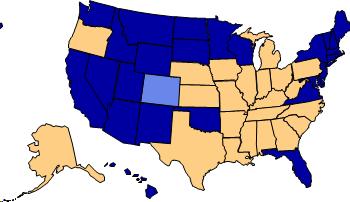
2000
(*BMI ?30, or about 30 lbs. overweight for 5'4" person)
2010

1990
No Data <10% 10%-14% 15%-19% 20%-24% 25%-29% =30%


Obesity Trends* Among U.S. Adults<br />BRFSS, 1990, 2000, 2010
We'll start this lesson with a visual display of the trends in obesity, ranging from 1985 through 2010. And on this slide you can see comparisons of obesity trends, we're talking about people with a body mass index of greater than or equal to 30, or about 30 pounds overweight for a 5'4" person, as you see here on this slide.
And so here you can see maps for 1990, 2000, and 2010, but the next several slides in this PowerPoint show you the progression year by year and state by state in the increases in obesity. So I want you to take a few moments and flip quickly through these maps on the next several slides and watch our nation becoming more and more obese over this relatively short period of time. Take a few minutes, flip quickly through this, and watch as the colors change progressively from white, light blue, to yellow, and then finally to red, where we are today in most states. Just watch that progression of becoming more and more obese.