Chapter 8
Table of Contents
- Chapter 8: Achieving and Maintaining a Healthy Weight
- Objectives
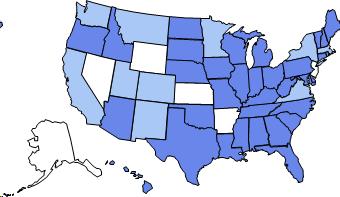
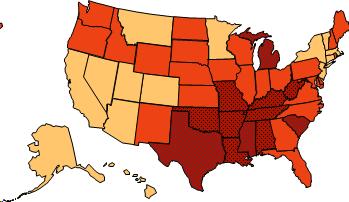
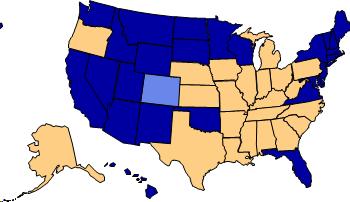
- Obesity Trends* Among U.S. Adults BRFSS, 1990, 2000, 2010
- Obesity Trends* Among U.S. Adults BRFSS, 1985
- Obesity Trends* Among U.S. Adults BRFSS, 1986
- Obesity Trends* Among U.S. Adults BRFSS, 1987
- Obesity Trends* Among U.S. Adults BRFSS, 1988
- Obesity Trends* Among U.S. Adults BRFSS, 1989
- Obesity Trends* Among U.S. Adults BRFSS, 1990
- Obesity Trends* Among U.S. Adults BRFSS, 1991
- Obesity Trends* Among U.S. Adults BRFSS, 1992
- Obesity Trends* Among U.S. Adults BRFSS, 1993
- Obesity Trends* Among U.S. Adults BRFSS, 1994
- Obesity Trends* Among U.S. Adults BRFSS, 1995
- Obesity Trends* Among U.S. Adults BRFSS, 1996
- Obesity Trends* Among U.S. Adults BRFSS, 1997
- Obesity Trends* Among U.S. Adults BRFSS, 1998
- Obesity Trends* Among U.S. Adults BRFSS, 1999
- Obesity Trends* Among U.S. Adults BRFSS, 2000
- Obesity Trends* Among U.S. Adults BRFSS, 2001
- Obesity Trends* Among U.S. Adults BRFSS, 2001
- Obesity Trends* Among U.S. Adults BRFSS, 2003
- Obesity Trends* Among U.S. Adults BRFSS, 2004
- Obesity Trends* Among U.S. Adults BRFSS, 2005
- Obesity Trends* Among U.S. Adults BRFSS, 2006
- Obesity Trends* Among U.S. Adults BRFSS, 2007
- Obesity Trends* Among U.S. Adults BRFSS, 2008
- Obesity Trends* Among U.S. Adults BRFSS, 2009
- Obesity Trends* Among U.S. Adults BRFSS, 2010
- Obesity trends slides
- Health Risks for Overweight People
- Overweight and Obesity
- Body Mass Index
- Body Mass Index Classifications
- BMI and Mortality
- Body Fat Distribution
- Visceral Fat
- Waist Circumference Measure
- Body Composition
- Body Fatness of a Typical Man and Woman
- Measuring Body Composition (1 of 2)
- Measuring Body Composition (2 of 2)
- Maintaining a Healthy Weight
- Energy Expenditure: How We Use Calories
- Factors associated with Overweight and Obesity
- A Lifestyle Approach to Achieving and Maintaining a Healthy Weight
- Physical Activity and Fat Loss
- Healthy Eating for Fat Loss
- Body Image and Weight
- Eating Disorders
- Take-home points
- Sources
Text and Images from Slide
2000
(*BMI ?30, or about 30 lbs. overweight for 5'4" person)
2010

1990
No Data <10% 10%-14% 15%-19% 20%-24% 25%-29% =30%


Obesity Trends* Among U.S. Adults<br />BRFSS, 1990, 2000, 2010
