
Chapter 14
Table of Contents
- Chapter 8: Protecting Your Cardiovascular System
- Objectives
- Cardiovascular disease mortality trends for males & females (United States: 1979-2008)
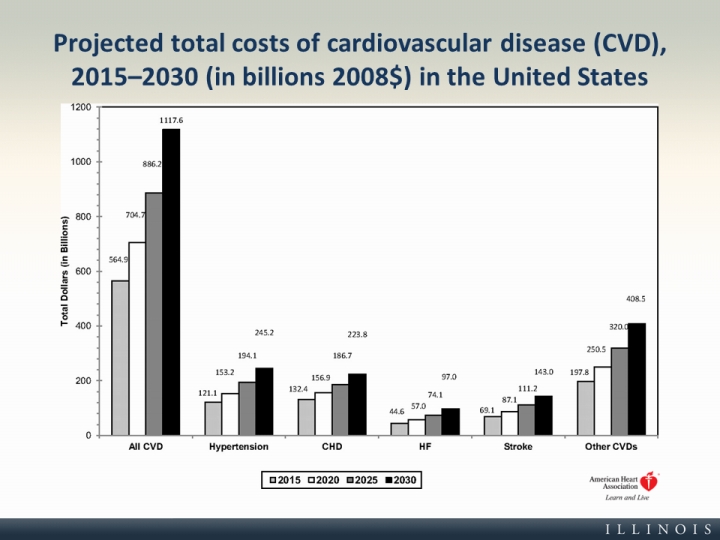
- Projected total costs of cardiovascular disease (CVD), 2015-2030 (in billions 2008$) in the United States
- Cardiovascular Disease (CVD)
- Deaths from Cardiovascular Disease
- Atherosclerosis: The Enemy Within
- Progression of Atherosclerosis
- Coronary Heart Disease - CHD (1)
- Coronary Heart Disease - CHD (2)
- Heart Attack
- Stroke
- Areas of the Brain Affected by Stroke
- Public Education Messages for Stroke
- High Blood Pressure (HBP)
- Blood Pressure
- Categories for Blood Pressure Levels in Adults
- Causes of High Blood Pressure (HBP)
- Congestive Heart Failure
- CVD Major Risk Factors
- Major Risk Factors: Cigarette Smoking
- Immediate and Long-term Health Benefits of Quitting Smoking
- Major Risk Factors: Physical Inactivity (1)
- Major Risk Factors: Physical Inactivity (2)
- Major Risk Factors: High Blood Fats
- Classification of Total, LDL, HDL Cholesterol, and Triglycerides Levels in Adults
- Major Risk Factors: High Blood Pressure
- Nine Things You Can Do to Prevent and Control Blood Pressure
- Major Risk Factors: Being Overweight/Obese
- Major Risk Factors: Diabetes Mellitus
- Contributing CVD Risk Factors
- Non-Modifiable CVD Major Risk Factors
- References
Text and Images from Slide
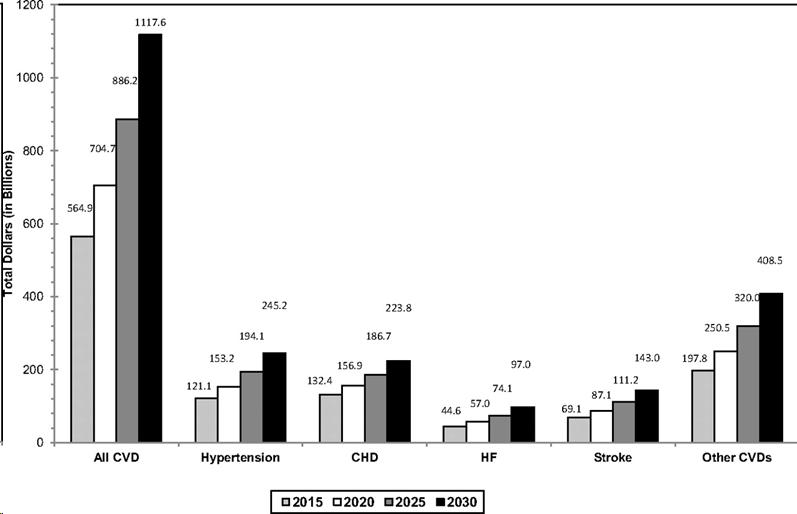
Projected total costs of cardiovascular disease (CVD), <br />2015-2030 (in billions 2008$) in the United States