KIN 401: Lesson 2, Part 3, Correlation
Table of Contents
- Lesson 2, Part 3: Correlation
- Correlation (1)
- Correlation (2)
- Correlation (3)
- Describing Relationships: An Example…
- Scatter Plot (1)
- Scatter Plot (2)
- Direction of Relationship: Positive
- Positive Relationship/Correlation
- Positive Correlation
- Direction of Relationship: negative
- Negative Correlation
- Negative Relationship/ Correlation (Bad?)
- No Correlation
- Perfect Correlation
- Form of Relationship
- Linear Relationship
- Strength of Relationship
- Correlation Coefficient: Definition
- Correlation Coefficients (1)
- Pearson's r
- A Correlation Example (1)
- A Correlation Example (2)
- A Correlation Example (3)
- A Correlation Example (4)
- A Correlation Example (5)
- Interpreting Correlation Coefficients
- Values of rs
- Correlation Coefficient (2)
- Interpreting Pearson's r (1)
- Interpreting Pearson's r (2)
- Interpreting Pearson's r (3)
- Coefficient of Determination: The Best One
- Coefficient of Determination
- Statistical Significance: Do Not Use It!
- Correlation and Causation
- Regression
Text and Images from Slide
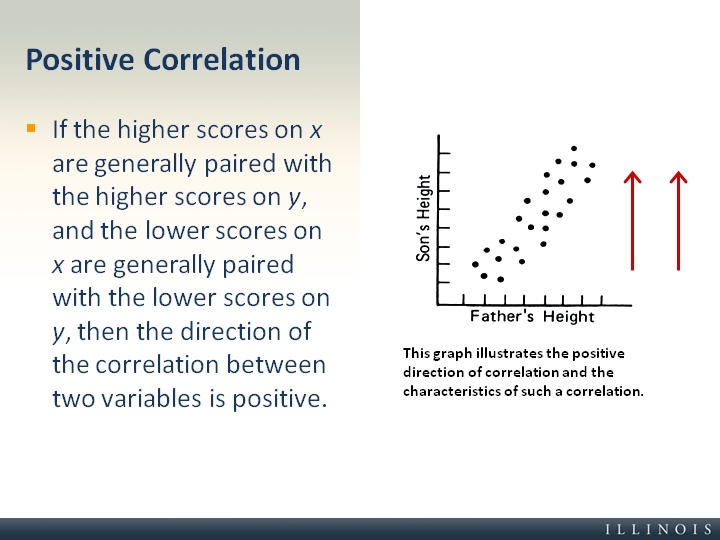
Positive Correlation
- If the higher scores on x are generally paired with the higher scores on y, and the lower scores on x are generally paired with the lower scores on y, then the direction of the correlation between two variables is positive.
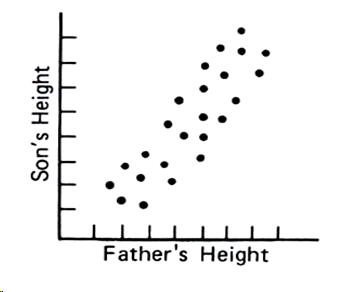


This graph illustrates the positive direction of correlation and the characteristics of such a correlation.