KIN 401: Lesson 2, Part 3, Correlation
Table of Contents
- Lesson 2, Part 3: Correlation
- Correlation (1)
- Correlation (2)
- Correlation (3)
- Describing Relationships: An Example…
- Scatter Plot (1)
- Scatter Plot (2)
- Direction of Relationship: Positive
- Positive Relationship/Correlation
- Positive Correlation
- Direction of Relationship: negative
- Negative Correlation
- Negative Relationship/ Correlation (Bad?)
- No Correlation
- Perfect Correlation
- Form of Relationship
- Linear Relationship
- Strength of Relationship
- Correlation Coefficient: Definition
- Correlation Coefficients (1)
- Pearson's r
- A Correlation Example (1)
- A Correlation Example (2)
- A Correlation Example (3)
- A Correlation Example (4)
- A Correlation Example (5)
- Interpreting Correlation Coefficients
- Values of rs
- Correlation Coefficient (2)
- Interpreting Pearson's r (1)
- Interpreting Pearson's r (2)
- Interpreting Pearson's r (3)
- Coefficient of Determination: The Best One
- Coefficient of Determination
- Statistical Significance: Do Not Use It!
- Correlation and Causation
- Regression
Text and Images from Slide
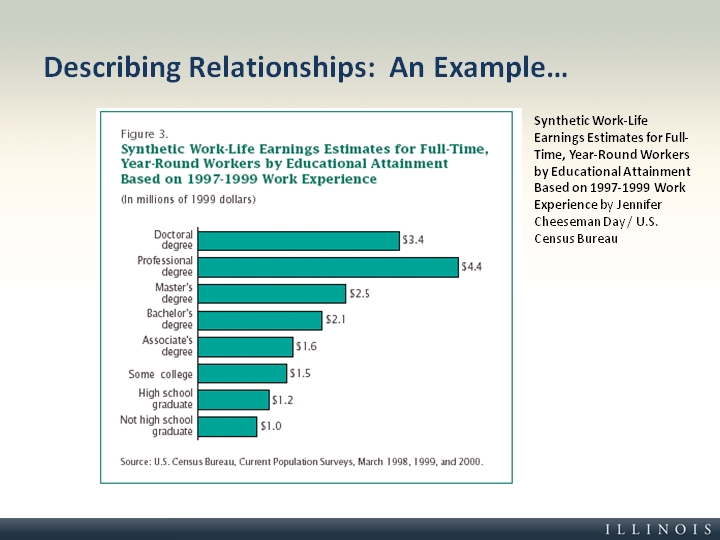
Describing Relationships: An Example…
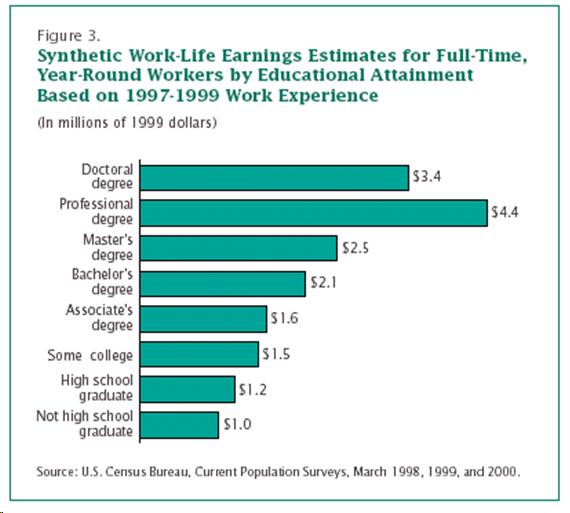
Synthetic Work-Life Earnings Estimates for Full-Time, Year-Round Workers by Educational Attainment Based on 1997-1999 Work Experience by Jennifer Cheeseman Day / U.S. Census Bureau