Previous

Full View

Contents of Evoked Potentials (3)

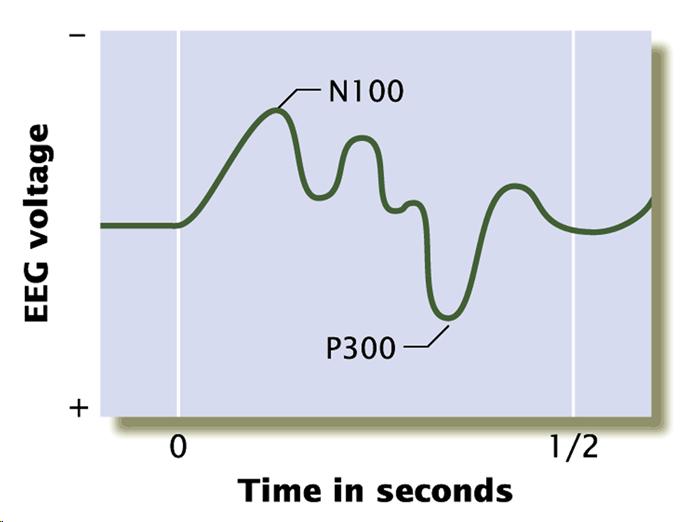
A diagram of the average EEG, or brain wave, tracing produced from several trials on which a research participant's name was presented. Evoke potentials are averaged in this way so as to eliminate random variations in the tracings. The result is the appearance of a negative peak (N100) followed by a large positive peak (P300). Traditionally, positive peaks are shown as decreases on such tracings, whereas negative onese are shown as increases.

Evoked Potentials (3)

Lecture Notes

And here we see sort of a visual representation on an EEG readout of an evoked potential, noting both the N100 in the negative voltage direction and the P300 in the positive voltage direction. Again, roughly equating to the process of sensation in the sensory cortex and of perception. This does bring a close to lecture part 1. Join me for lecture part 2 where we're going to talk more about problem solving and decision making.