
Chapter 8: Cognition and Language, Part 1
Table of Contents
- Chapter 8: Cognition and Language
- Cognition and Language
- Mental Representations, Thinking Strategies, and Biological Aspects of Cognition
- Mental Representations
- Schemas
- Draw a Penny
- 2010 U.S. Penny
- Draw a Penny: Analysis
- Schema Example
- Rocky Story (1)
- Rocky Story (2)
- About the Rocky Story
- Amy
- Amy: Questions
- About the Amy Story
- Scripts
- Concepts
- Thinking Strategies
- Formal Reasoning
- Informal Reasoning
- Anchoring Heuristic
- Scenario
- Representativeness Heuristic
- Availability Heuristic
- Biological Aspects of Cognition
- Evoked Potentials (1)
- Evoked Potentials (2)
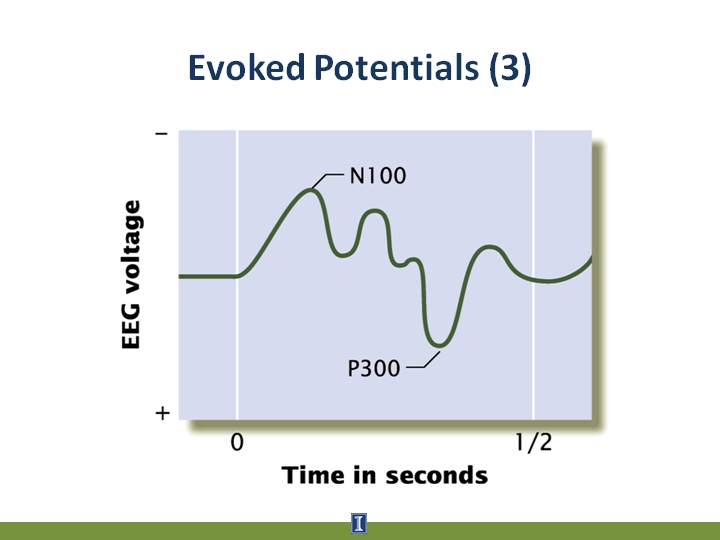
- Evoked Potentials (3)
Text and Images from Slide
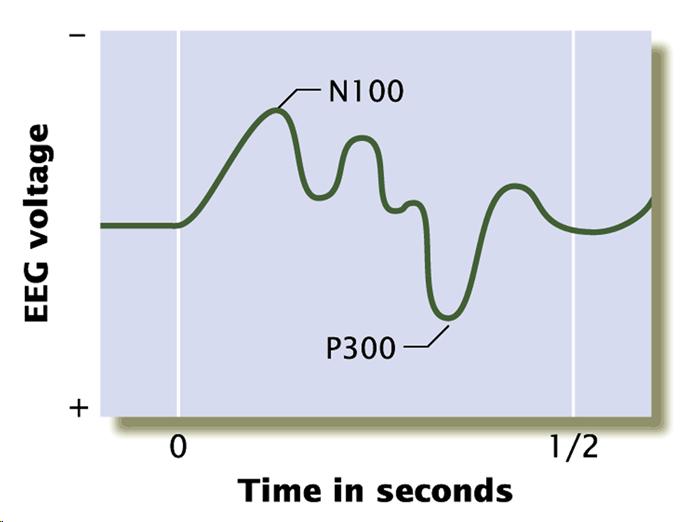
Evoked Potentials (3)