Chapter 4
Table of Contents
- Chapter 4 The Heart of Physical Activity: Cardiorespiratory Endurance
- Objectives
- Components of Health-Related Physical Fitness
- Why is cardiorespiratory fitness important?
- Aerobic Activity Improves Cardiorespiratory Endurance
- Aerobic vs. Anaerobic Activity
- The Circulatory System
- The Heart
- Blood Flow Through the Heart
- The Blood Vessels
- Cardiac Output, Stroke Volume, and Heart Rate
- Cardiac Changes with Improved Fitness
- Oxygen Consumption During Exercise
- Measuring Cardiorespiratory Fitness (1)
- Measuring Cardiorespiratory Fitness (2)
- Measuring Cardiorespiratory Fitness (3)
- Measuring Cardiorespiratory Fitness (4)
- FITT Formula
- Using the FITT Formula to Design a Cardiorespiratory Fitness Program
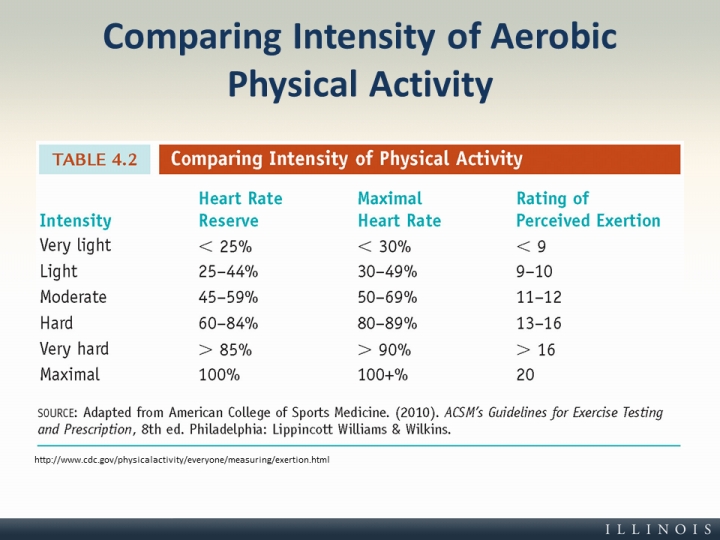
- Comparing Intensity of Aerobic Physical Activity
- Monitoring Your Intensity (1)
- Monitoring Your Intensity (2)
- Monitoring Your Intensity (3)
- Monitoring Your Intensity (4)
- Designing Your Cardiorespiratory Fitness Program
- Choosing an Activity
- Sources
Text and Images from Slide
Comparing Intensity of Aerobic Physical Activity
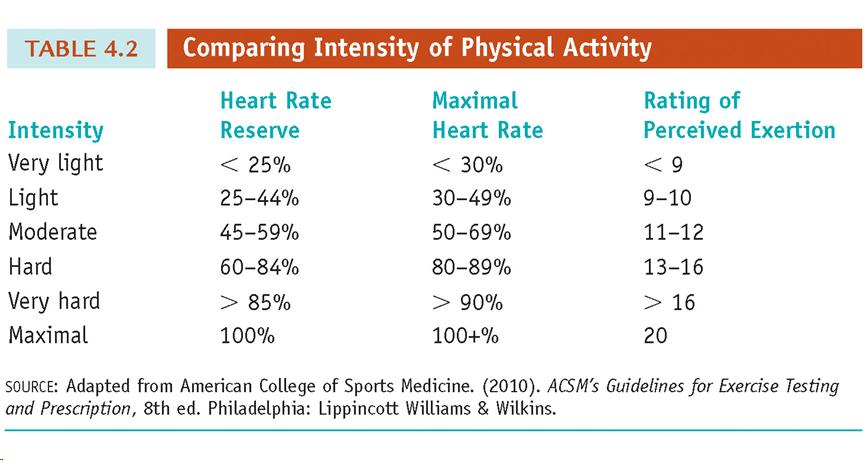

http://www.cdc.gov/physicalactivity/everyone/measuring/exertion.html