KIN 122 - Chapter 10
Table of Contents
- Chapter 10: Understanding Mental Health and Coping with Stress
- Objectives
- Mental and Emotional Health (1)
- Mental and Emotional Health (2)
- Physical Activity and Mental Health (1)
- Mind-Body Relationship
- Mental Illness
- Mental Illnesses: Anxiety Prevalence
- Mental Illnesses: Depression Prevalence
- Mental Illnesses: Cost
- Mental Illnesses: Anxiety (1)
- Mental Illnesses: Anxiety (2)
- Mental Illnesses: Depression (1)
- Mental Illnesses: Depression (2)
- Physical Activity and Mental Health (2)
- Understanding Stress (1)
- Understanding Stress (2)
- Understanding Stress (3)
- Signs and Symptoms of Unsuccessful Coping
- The Three Phases of the General Adaptation Syndrome and Three Major Physiological Pathways
- Understanding Stress (4)
- Understanding Stress (5)
- Understanding Stress (6)
- The Stress-Illness Relationship
- Three Approaches to Stress Management (1)
- Three Approaches to Stress Management (2)
- Three Approaches to Stress Management (3)
- Physical Activity for Mental Health: Mechanisms (1)
- Physical Activity for Mental Health: Mechanisms (2)
- Physical Activity for Mental Health: Mechanisms (3)
- Quick Relaxation Techniques
- Physical Activity and Mental Health (3)
- References
Text and Images from Slide
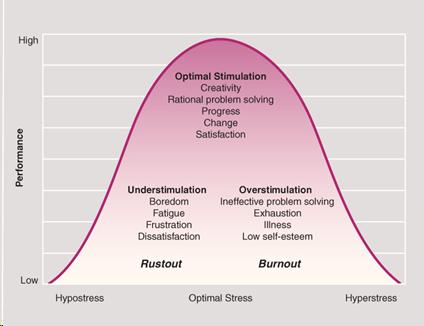
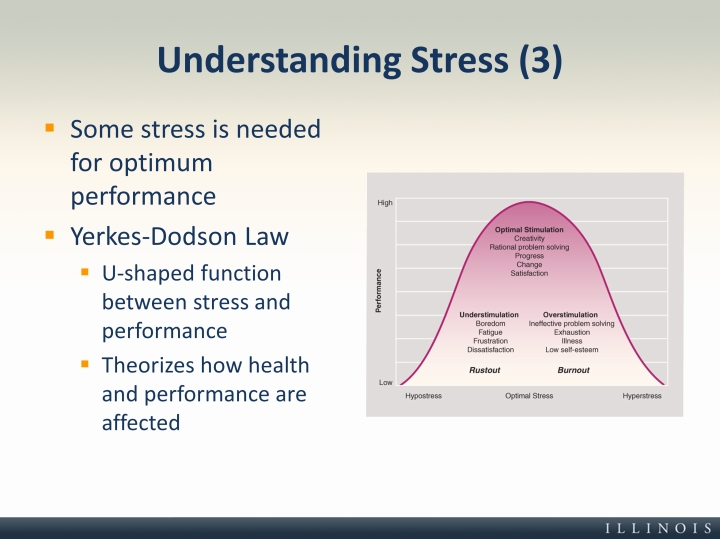
Understanding Stress (3)
- Some stress is needed for optimum performance
- Yerkes-Dodson Law
- U-shaped function between stress and performance
- Theorizes how health and performance are affected